NIRF under the Microscope
By Praveen Dwarakanath, Founder, Accendere Knowledge Management Services
April 03, 2017 saw a great deal of fanfare when the second edition of NIRF was released by the new HRD Minister Prakash Javadekar. The rankings would hold great importance for students, parents, academicians and other stakeholders across the country.
I took up the exercise to build a deeper understanding of the underlying factors that influence the rankings and in turn would create an impact on the lives of 16 year old students across the country.
I aim to analyze this effort of MHRD in relation to its global peers in order to determine its usefulness. Let us start with the methodology. The NIRF uses five principal parameters in its ranking:
- Teaching, Learning and Resources (30% weightage)
- Research and Professional Practice (30% weightage)
- Graduation Outcomes (20% weightage)
- Outreach and Inclusivity (10% weightage)
- Perception (10% weightage)
Let us compare this with other global rankings. Most global rankings have parameters that are similar and for the purpose of brevity, we will compare the NIRF with one of the more popular rankings the QS world rankings. Below is an indication of parameters taken by the QS world ranking.
|
Indicator |
Weight |
|
Academic peer review |
40% |
|
Faculty/Student ratio |
20% |
|
Citations per faculty |
20% |
|
Employer reputation |
10% |
|
International student ratio |
5% |
|
International staff ratio |
5% |
The difference that can be noted is the ability of an institution to provide data that can be independently verified. The QS world ranking has:
- Faculty/Student ratio - 20%
- International Student ratio - 5%
- International staff ratio - 5%
This comes to a sum total of 30% of the ranking’s weight that is difficult to independently verify by the ranking agency. Let us now contrast this with NIRF:
- Teaching, Learning and Resources - 30%
- Part D of Research and Professional Practice - 4.5%
- Graduation Outcome - 20%
- Outreach and Inclusivity - 10%
This brings it to a grand total of 64.5% of the ranking that relies on the data that is provided by the institution.
Some interesting trends and my comments on the same can be noted below:
- Less than 25% of Universities in the top 100 are privately funded
- The top 10 Public funded universities spent an average of Rs. 6.7 lac per student on their campus in capital expenditure and Rs. 9.6lac in operational expenditure every year. While a part of this is set off by funding that they receive for consulting projects, it would not be an unfair assumption to note that there is no way they would be able to spend this kind of money if not subsidized by the government. The equivalent figures for the top 10 Privately funded universities are Rs. 2.2 lac and Rs. 10 lac
- When it comes to TLR, the difference between the top 10 public and top 10 private universities is not stark. The public universities have an average TLR of 62 as opposed to 53 for private. This suggests that the Student/Faculty Ratios is not too different between private and public universities.
- The quality of faculty is what makes the difference. The average number of citations in scopus indexed journals by faculty from the top 10 public funded universities in the last 3 years is a mind boggling 41 as opposed to just 8 from the top 10 private funded universities. This shows a stark difference in the quality of faculty engaged by the public and private funded universities
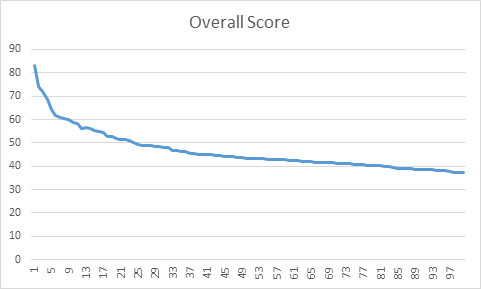
- (Figure A.) The X-axis denotes the rank of the institution and the Y-axis denotes the overall score achieved by the institution as a weighted average of all parameters involved. This shows the slope of the graph drastically falling around rank 20. This is where the Outreach and Inclusivity and Perception end up making a huge difference. This 20% can potentially swing a bottom 10 institution into a top 30.
- The much abused JNU with a perception score of just 6.92 makes it to the top 15. Now, it gets there on the back of excellent numbers in TLR and GO but does not have equivalent numbers for RPC. This suggests that the institute is receiving a lot of funding but does not give the taxpayer equivalent bang for the buck.
- The dark horse of the ranking is Bharath Institute of Higher Education and Research. The University makes a stellar comeback from being blacklisted to ranking 35 in the NIRF within the space of 5 years. It has a perception score of just 3.79 but has extremely strong TLR, GO and OI numbers for its space. Its RPC is also satisfactory. It would be interesting to note that had Bharath got a better perception score, it may have ranked in the top 20.
Overall, it is a fascinating read for those interested in this sector and promise to usher in an era of accountability. The level of transparency and ability to independently verify must go up in the coming years.
All information contained in this post is via independent analysis. Given the level of manual data collection, there is a potential for human error. The author/company are not responsible for any decision taken out of the same.